Cómo instalar el software de monitorización Linux Grafana en Ubuntu 22.04
Grafana es un panel de métricas y una herramienta de visualización de datos gratuitos, de código abierto y repletos de funciones. Está diseñada para Graphite, Elasticsearch, OpenTSDB, Prometheus e InfluxDB para supervisar las métricas desde una interfaz basada en web. Es multiplataforma y tiene más de 100 plugins para recopilar, almacenar, visualizar y compartir datos. Te permite crear alertas y notificaciones para tus datos y facilitar la colaboración con tus compañeros de equipo mediante funciones para compartir.
Este tutorial explicará cómo instalar Grafana 8 en Ubuntu 22.04.
Requisitos previos
- Un servidor que ejecute Ubuntu 22.04.
- Un nombre de dominio válido apuntado con la IP de tu servidor.
- Una contraseña de root configurada en el servidor.
Cómo empezar
Antes de empezar, se recomienda actualizar tu sistema a la versión actualizada. Puedes actualizar todos los paquetes utilizando el siguiente comando:
apt-get update -y
apt-get upgrade -y
Una vez actualizados todos los paquetes, instala otras dependencias necesarias utilizando el siguiente comando:
apt-get install gnupg2 curl wget git software-properties-common -y
Una vez instalados todos los paquetes, puedes pasar al siguiente paso.
Instalar Grafana 8 en Ubuntu 22.04
Por defecto, Grafana no está incluido en el repositorio por defecto de Ubuntu 22.04. Así que tendrás que añadir el repositorio de Grafana al APT. Puedes añadirlo utilizando el siguiente comando:
curl https://packages.grafana.com/gpg.key | apt-key add -
add-apt-repository "deb https://packages.grafana.com/oss/deb stable main"
Una vez añadido el repositorio, actualiza la caché del repositorio e instala Grafana utilizando el siguiente comando:
apt-get update -y
apt-get install grafana -y
Una vez instalado Grafana, inicia y habilita el servicio Grafana utilizando el siguiente comando:
systemctl start grafana-server
systemctl enable grafana-server
También puedes comprobar el estado del servicio Grafana con el siguiente comando:
systemctl status grafana-server
Obtendrás la siguiente salida:
? grafana-server.service - Grafana instance
     Loaded: loaded (/lib/systemd/system/grafana-server.service; disabled; vendor preset: enabled)
     Active: active (running) since Sat 2022-08-06 09:33:06 UTC; 7s ago
       Docs: http://docs.grafana.org
   Main PID: 69737 (grafana-server)
      Tasks: 9 (limit: 2242)
     Memory: 37.1M
        CPU: 1.580s
     CGroup: /system.slice/grafana-server.service
             ??69737 /usr/sbin/grafana-server --config=/etc/grafana/grafana.ini --pidfile=/run/grafana/grafana-server.pid --packaging=deb cfg>

Aug 06 09:33:08 ubuntu2204 grafana-server[69737]: logger=secrets t=2022-08-06T09:33:08.517381147Z level=info msg="Envelope encryption state" >
Aug 06 09:33:08 ubuntu2204 grafana-server[69737]: logger=query_data t=2022-08-06T09:33:08.527197639Z level=info msg="Query Service initializa>
Aug 06 09:33:08 ubuntu2204 grafana-server[69737]: logger=live.push_http t=2022-08-06T09:33:08.544920469Z level=info msg="Live Push Gateway in>
Aug 06 09:33:13 ubuntu2204 grafana-server[69737]: logger=ngalert t=2022-08-06T09:33:13.723313517Z level=warn msg="failed to delete old am con>
Aug 06 09:33:13 ubuntu2204 grafana-server[69737]: logger=infra.usagestats.collector t=2022-08-06T09:33:13.885398731Z level=info msg="register>
Aug 06 09:33:13 ubuntu2204 grafana-server[69737]: logger=server t=2022-08-06T09:33:13.886028388Z level=info msg="Writing PID file" path=/run/>
Aug 06 09:33:13 ubuntu2204 grafana-server[69737]: logger=http.server t=2022-08-06T09:33:13.900761945Z level=info msg="HTTP Server Listen" add>
Aug 06 09:33:13 ubuntu2204 grafana-server[69737]: logger=ngalert t=2022-08-06T09:33:13.901994976Z level=info msg="warming cache for startup"
Aug 06 09:33:13 ubuntu2204 grafana-server[69737]: logger=ngalert.multiorg.alertmanager t=2022-08-06T09:33:13.902506414Z level=info msg="start>
Aug 06 09:33:13 ubuntu2204 grafana-server[69737]: logger=grafanaStorageLogger t=2022-08-06T09:33:13.926571246Z level=info msg="storage starti>
Por defecto, Grafana escucha en el puerto 3000. Puedes comprobarlo con el siguiente comando:
ss -antpl | grep 3000
Obtendrás el siguiente resultado:
LISTEN 0 4096 *:3000 *:* users:(("grafana-server",pid=69737,fd=8))
Instalar Nginx como proxy inverso para Grafana
Por defecto, se puede acceder a Grafana a través del puerto 3000 . Por lo tanto, tendrás que instalar y configurar Nginx como proxy inverso para que Grafana acceda a través del puerto 80. En primer lugar, instala el Nginx utilizando el siguiente comando:
apt-get install nginx -y
Una vez instalado el Nginx, crea un archivo de configuración del host virtual Nginx con el siguiente comando:
nano /etc/nginx/conf.d/grafana.conf
Añade las siguientes líneas:
server {
        server_name grafana.example.com;
        listen 80;
        access_log /var/log/nginx/grafana.log;


        location / {
                proxy_pass http://localhost:3000;
                proxy_set_header Host $http_host;
                proxy_set_header X-Forwarded-Host $host:$server_port;
                proxy_set_header X-Forwarded-Server $host;
                proxy_set_header X-Forwarded-For $proxy_add_x_forwarded_for;
        }
}
Guarda y cierra el archivo cuando hayas terminado. A continuación, comprueba si Nginx tiene algún error de sintaxis con el siguiente comando:
nginx -t
Si todo va bien, obtendrás la siguiente salida:
nginx: the configuration file /etc/nginx/nginx.conf syntax is ok
nginx: configuration file /etc/nginx/nginx.conf test is successful
A continuación, reinicia el Nginx para aplicar los cambios de configuración.
systemctl restart nginx
También puedes comprobar el estado de Nginx con el siguiente comando:
systemctl status nginx
Obtendrás la siguiente salida:
? nginx.service - A high performance web server and a reverse proxy server
     Loaded: loaded (/lib/systemd/system/nginx.service; enabled; vendor preset: enabled)
     Active: active (running) since Sat 2022-08-06 09:35:32 UTC; 4s ago
       Docs: man:nginx(8)
    Process: 70326 ExecStartPre=/usr/sbin/nginx -t -q -g daemon on; master_process on; (code=exited, status=0/SUCCESS)
    Process: 70327 ExecStart=/usr/sbin/nginx -g daemon on; master_process on; (code=exited, status=0/SUCCESS)
   Main PID: 70328 (nginx)
      Tasks: 2 (limit: 2242)
     Memory: 2.6M
        CPU: 42ms
     CGroup: /system.slice/nginx.service
             ??70328 "nginx: master process /usr/sbin/nginx -g daemon on; master_process on;"
             ??70329 "nginx: worker process" "" "" "" "" "" "" "" "" "" "" "" "" "" "" "" "" "" "" "" "" "" "" "" "" "" "" ""

Aug 06 09:35:32 ubuntu2204 systemd[1]: Starting A high performance web server and a reverse proxy server...
Aug 06 09:35:32 ubuntu2204 systemd[1]: Started A high performance web server and a reverse proxy server.
En este punto, Nginx está instalado y configurado como proxy inverso para Grafana. Ahora puedes pasar al siguiente paso.
Accede al panel de Grafana
Ahora, abre tu navegador web y accede a la interfaz web de Grafana utilizando la URL http://grafana.example.com. Se te redirigirá a la página de inicio de sesión de Grafana:
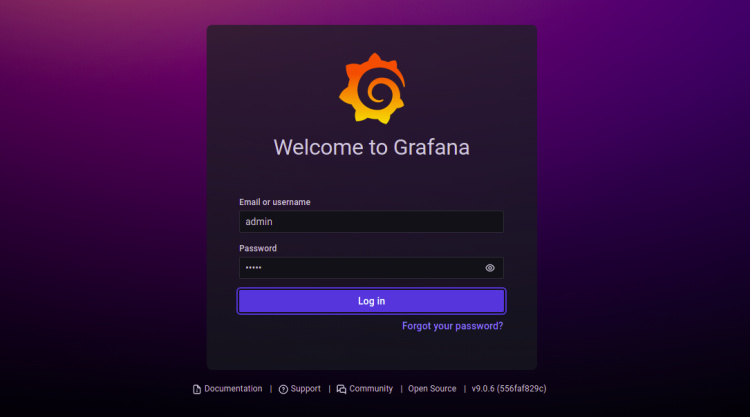
Proporciona el nombre de usuario admin por defecto, la contraseña como admin/admin y haz clic en el botón Iniciar sesión. Deberías ver la pantalla de restablecimiento de contraseña de Grafana:
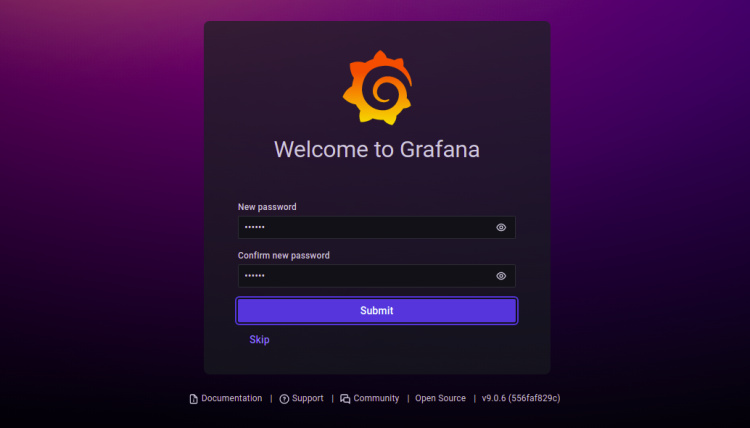
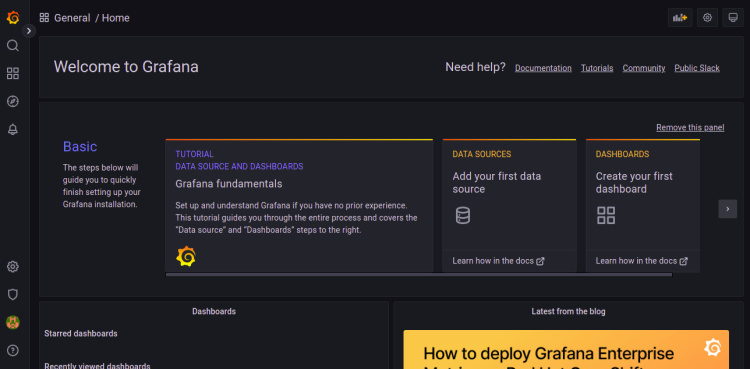
Establece tu nueva contraseña y pulsa el botón Enviar. Deberías ver el panel de control de Grafana en la siguiente pantalla:
Asegura Grafana con Let’s Encrypt
A continuación, tendrás que instalar el paquete cliente Certbot para instalar y gestionar el SSL Let’s Encrypt.
Primero, instala el Certbot con el siguiente comando:
apt-get install certbot python3-certbot-nginx -y
Una vez finalizada la instalación, ejecuta el siguiente comando para instalar el SSL de Let’s Encrypt en tu sitio web:
certbot --nginx -d grafana.example.com
Se te pedirá que proporciones una dirección de correo electrónico válida y que aceptes las condiciones del servicio, como se muestra a continuación:
Saving debug log to /var/log/letsencrypt/letsencrypt.log
Plugins selected: Authenticator nginx, Installer nginx
Enter email address (used for urgent renewal and security notices) (Enter 'c' to
cancel): [email protected]

- - - - - - - - - - - - - - - - - - - - - - - - - - - - - - - - - - - - - - - -
Please read the Terms of Service at
https://letsencrypt.org/documents/LE-SA-v1.2-November-15-2017.pdf. You must
agree in order to register with the ACME server at
https://acme-v02.api.letsencrypt.org/directory
- - - - - - - - - - - - - - - - - - - - - - - - - - - - - - - - - - - - - - - -
(A)gree/(C)ancel: A

- - - - - - - - - - - - - - - - - - - - - - - - - - - - - - - - - - - - - - - -
Would you be willing to share your email address with the Electronic Frontier
Foundation, a founding partner of the Let's Encrypt project and the non-profit
organization that develops Certbot? We'd like to send you email about our work
encrypting the web, EFF news, campaigns, and ways to support digital freedom.
- - - - - - - - - - - - - - - - - - - - - - - - - - - - - - - - - - - - - - - -
(Y)es/(N)o: Y
Obtaining a new certificate
Performing the following challenges:
http-01 challenge for grafana.example.com
Waiting for verification...
Cleaning up challenges
Deploying Certificate to VirtualHost /etc/nginx/conf.d/grafana.conf
A continuación, elige si deseas o no redirigir el tráfico HTTP a HTTPS, como se muestra a continuación:
- - - - - - - - - - - - - - - - - - - - - - - - - - - - - - - - - - - - - - - -
1: No redirect - Make no further changes to the webserver configuration.
2: Redirect - Make all requests redirect to secure HTTPS access. Choose this for
new sites, or if you're confident your site works on HTTPS. You can undo this
change by editing your web server's configuration.
- - - - - - - - - - - - - - - - - - - - - - - - - - - - - - - - - - - - - - - -
Select the appropriate number [1-2] then [enter] (press 'c' to cancel): 2
Escribe 2 y pulsa Intro para finalizar la instalación. Deberías ver el siguiente resultado:
Redirecting all traffic on port 80 to ssl in /etc/nginx/conf.d/grafana.conf

- - - - - - - - - - - - - - - - - - - - - - - - - - - - - - - - - - - - - - - -
Congratulations! You have successfully enabled https://grafana.example.com

You should test your configuration at:
https://www.ssllabs.com/ssltest/analyze.html?d=grafana.example.com
- - - - - - - - - - - - - - - - - - - - - - - - - - - - - - - - - - - - - - - -

IMPORTANT NOTES:
 - Congratulations! Your certificate and chain have been saved at:
   /etc/letsencrypt/live/grafana.example.com/fullchain.pem
   Your key file has been saved at:
   /etc/letsencrypt/live/grafana.example.com/privkey.pem
   Your cert will expire on 2022-05-07. To obtain a new or tweaked
   version of this certificate in the future, simply run certbot again
   with the "certonly" option. To non-interactively renew *all* of
   your certificates, run "certbot renew"
 - Your account credentials have been saved in your Certbot
   configuration directory at /etc/letsencrypt. You should make a
   secure backup of this folder now. This configuration directory will
   also contain certificates and private keys obtained by Certbot so
   making regular backups of this folder is ideal.
 - If you like Certbot, please consider supporting our work by:

   Donating to ISRG / Let's Encrypt:   https://letsencrypt.org/donate
   Donating to EFF:                    https://eff.org/donate-le

 - We were unable to subscribe you the EFF mailing list because your
   e-mail address appears to be invalid. You can try again later by
   visiting https://act.eff.org.
Conclusión
Enhorabuena! has instalado correctamente Grafana 8 con Nginx como proxy inverso y Let’s Encrypt SSL en Ubuntu 22.04. Ahora puedes añadir tus fuentes de datos externas a Grafana y empezar a monitorizarlas desde el panel de control de Grafana. No dudes en preguntarme si tienes alguna duda.